NOTE: THIS ARTICLE WAS WRITTEN ON JULY 20th 2004 AND IS PRETTY OBSOLETE BY NOW...
AVR JTAG MICRO ICE MINI HOWTO
AVR JTAG MICRO ICE is a device used to program and debug Atmel's
AVR microcontrollers with built in JTAG interface (typically all ATmegas 16 and up).
It is very useful for rapid application development - it is like
a microscope which can be used for viewing what is going on
inside a microcontroller. Variables watching, stepping,
breakpoints, all of this speeds up development cycle,
especially when something goes the way we don't expect.
The following text describes how to run the AVR JTAG MICRO ICE
adapter with the Little E3D2 board.
1. Connecting to the Little E3D2
As the Little E3D2 board doesn't have dedicated JTAG interface
connector, the AVR JTAG MICRO ICE must be connected to it through
a special cable (provided in Little E3D2 kit):
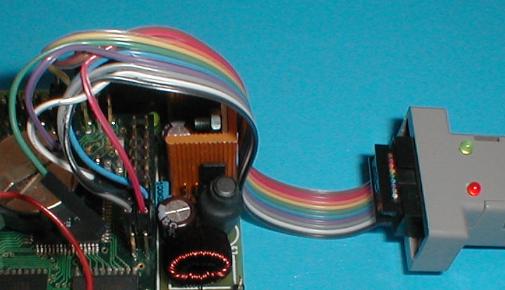
The connection on the picture above uses totally 6 wires.
Four of them are connected to PORTF4 - PORTF7, two remaining
are used for powering the ICE.
2. Connecting to the PC
Connect the ICE to any free COM port on the PC.
3. Running AVR Studio 4
Programming and debugging through ICE is done from within the AVRStudio.
AVRStudio 4 or AVRStudio 3 can be chosen to drive the ICE.
I have chosen version 4, simply because it is newer.
4. Programming the Little E3D2
Power on the Little E3D2 board with JTAG ICE connected.
In AVRStudio go to the menu Tools -> STK500/AVRISP/JTAG ICE -> STK500/AVRISP/JTAG ICE.
If the ICE is connected properly on both ends "JTAG ICE" window pops up.

Choose correct device (ATmega128) and file that you wish to fill into the Little E3D2.
Press "Program" button. Then the Little E3D2 will be programmed, it usually takes few seconds
or tens of seconds to complete.
Note: You can increase communication speed between PC and ICE up to 115200 Bd in Advanced tab.
5. Debugging WINAVR code with AVR Studio 4
I will use udphello application based on the uIP stack in this example.
Compile and link the application (make all).
Then create extended coff file (make extcoff).
Then start the AVR Studio and load the udphello.cof file into it.
Select Open File from the File menu to load udphello.cof.
Note: Use AVRStudio 4.09
The AVR Studio then loads the desired file and pops up
a window with setup questions:

Select debug platform (JTAG ICE) and device (ATmega128) according to the picture above,
then press Finish.

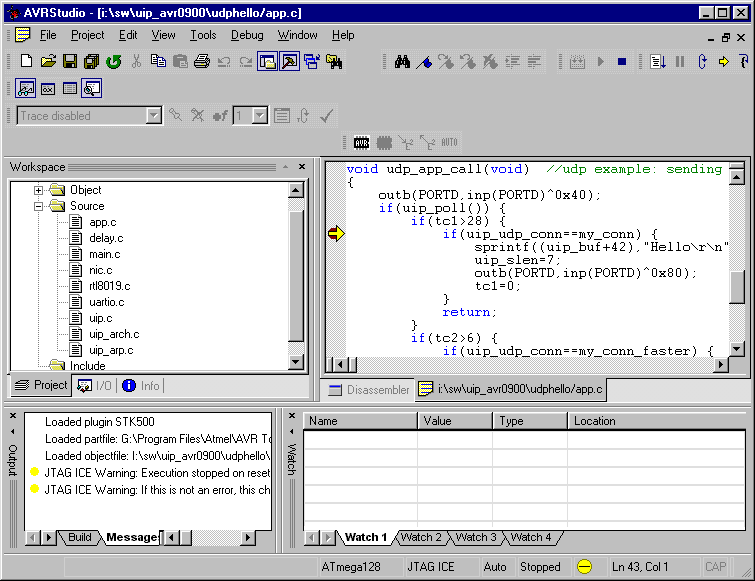
Now you can set a breakpoint. Click on the project tab window and double click on app.c
The app.c is opened in the right window. Go to udp_app_call function then click with the right mouse button on
the source code line and select Toggle Breakpoint from the popup menu.
Now select Run from the Debug menu. Now the application runs until it reaches the line
with the breakpoint. A yellow arrow appears on the breakpoint mark when this occurs.
Now you can manually step through the code (keys F10, F11),
watching variables (View -> Watch, right mouse button, AddItem....), etc.
Conclusion.
Having an JTAG ICE class device connected to a development system saves
development time and cost (and sometimes developer's nerves).
And these are the reasons why the AVR JTAG MICRO ICE device is a standard
part of the Little E3D2 kit.
© michal at vanka dot net on July 20th, 2004